注意力机制
什么是注意力机制
在深度学习领域,模型往往需要接收和处理大量的数据,然而在特定的某个时刻,往往只有少部分的某些数据是重要的
心理学框架:人类根据随意线索和不随意线索选择注意点
卷积、全连接、池化层都只考虑不随意线索(将本身容易抽取的特征抽取出来)
注意力机制则考虑随意线索
- 随意线索对应查询(query)
- 每个输入是值(value)和不随意线索(key)的对
- 通过注意力池化层来有偏向性地选择某些输入
非参注意力池化层
对于给定的数据$(x_i,y_i),i=1,…,n$)(key, value)
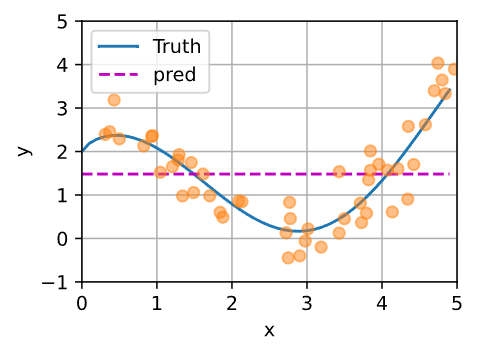
最简单的方案:平均池化 $f(x)=\frac{1}{n}\sum\limits_{i}{y_i}$
1
2
3
4
5
6
7
8
9
10
11
12
13
14
15
16
17
18
19
20
21
22
23
24
25
26
27
| import matplotlib.pyplot as plt
import torch
from torch import nn
from d2l import torch as d2l
n_train = 50
x_train, _ = torch.sort(torch.rand(n_train) * 5)
def f(x):
return 2 * torch.cos(x) + x ** 0.7
y_train = f(x_train) + torch.normal(0, 0.5, (n_train,))
x_test = torch.arange(0, 5, 0.1)
y_truth = f(x_test)
n_test = len(x_test)
def plot_kernel_reg(y_hat):
d2l.plot(x_test, [y_truth, y_hat], 'x', 'y', legend=['Truth', 'pred'], xlim=[0, 5], ylim=[-1, 5])
d2l.plt.plot(x_train, y_train, 'o', alpha=0.5)
plt.show()
y_hat = torch.repeat_interleave(y_train.mean(), n_test)
plot_kernel_reg(y_hat)
|

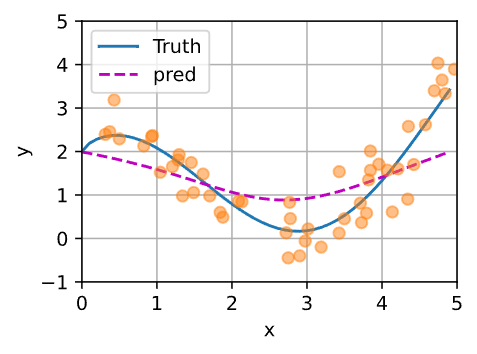
更好的方案:Nadaraya-Watson 核回归:
(找到离已知值最近的值,类似于KNN)
1
2
3
4
5
6
7
8
9
|
X_repeat = x_test.repeat_interleave(n_train).reshape((-1, n_train))
attention_weights = nn.functional.softmax(-(X_repeat - x_train) ** 2 / 2, dim=1)
y_hat = torch.matmul(attention_weights, y_train)
plot_kernel_reg(y_hat)
|

参数化注意力机制
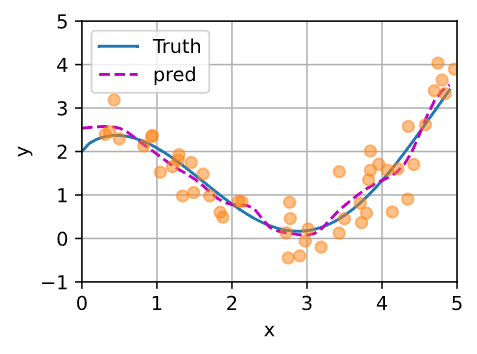
在此基础上引入可学习的参数w
1
2
3
4
5
6
7
8
9
10
11
12
13
14
15
16
17
18
19
20
21
22
23
24
25
26
27
28
29
30
31
32
33
34
35
36
37
| class NWKernelRegression(nn.Module):
def __init__(self, **kwargs):
super(NWKernelRegression, self).__init__()
self.w = nn.Parameter(torch.rand((1, ), requires_grad=True))
def forward(self, queries, keys, values):
queries = queries.repeat_interleave(keys.shape[1]).reshape((-1, keys.shape[1]))
self.attention_weights = nn.functional.softmax(
-((queries - keys) * self.w) ** 2 / 2, dim=1
)
return torch.bmm(
self.attention_weights.unsqueeze(1),
values.unsqueeze(-1)
).reshape(-1)
net = NWKernelRegression()
loss = nn.MSELoss(reduction='none')
optimizer = torch.optim.SGD(net.parameters(), lr=0.5)
animator = d2l.Animator(xlabel='epoch', ylabel='loss', xlim=[1, 5])
for epoch in range(5):
keys = x_train.repeat((n_test, 1))
values = y_train.repeat((n_test, 1))
y_hat = net(x_test, keys, values).unsqueeze(1).detach()
optimizer.zero_grad()
l = loss(net(x_train, keys, values), y_train)
l.sum().backward()
optimizer.step()
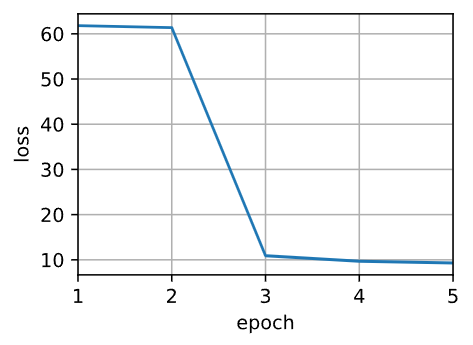
print(f'epoch {epoch + 1}, loss {float(l.sum()):.6f}')
animator.add(epoch + 1, float(l.sum()))
plt.show()
plot_kernel_reg(y_hat)
|

得到的曲线不如之前的平滑,但是更加接近真实值


